 One of the best visual aids to understanding influence, influencers and people’s behaviours online is the technograhics ladder created by Charlene Li and Josh Bernoff for their book, Groundswell, in 2007 and updated in early 2010. (Click the thumbnail to see the full image.)
The ladder makes it clear that the majority of people online are what Li and Bernoff call "spectators" (people who consume content rather than create it; it’s a high number, 70 percent) with a minority of "creators" – in essence, the reverse behaviour, representing 24 percent of people online who publish a blog, create and upload video and audio, etc – much of the content that the "spectators" consume.
What if there was another way of seeing people online that doesn’t pigeon-hole them so rigidly? That considers the emotional aspect of behaviours? Maybe that’s what Brian Solis can achieve with Behaviorgraphics: Discovering the “Me” in Social Media.

Solis takes a different approach, arguing that for the most part in social media today, people are seen by businesses as faceless consumers brought only to life through avatars, bios and a history of their online activities and connections.
[…] Sometimes we’re part of demographic studies where we’re grouped by age, income, gender, education, etc.. Sometimes, we’re part of psychographic studies where we’re grouped by commonalities, shared interests and passions, and themes. And often, we’re lumped together through keyword mentions or online influence scores. But the real question is, who are we online and what makes us connect, share, and live online? Finding these answers is revealing and hopefully, inspiring.
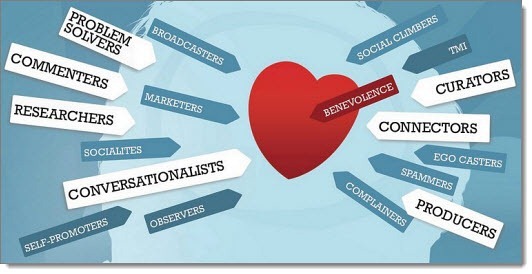
The result of Brian’s efforts are illustrated in the graphic you see above (or here if you don’t). He explains Behaviorgraphics thus:
Social media tests the filter that divides inner monologue from disclosure. As our thoughts become words online, they colour our avatars and profiles with a glimpse of our personality – who we are online and in the real world. Over time, it is how we put our words into action that establishes our character. And, it is our character, through the marriage of our words and actions, that paves the way for relationships and opportunities.
At the centre is Benevolence – The unselfish and kind-hearted behaviour that engenders and promotes recognition and reciprocity, and in doing so, earns the goodwill of those around them. This is the hub of social networking with a purpose, mission, and a genuine intent to grow communities based on trust, vision, and collaboration.
So it’s as much about each of us understanding our own descriptive metadata or metacontent, so to speak, as it is about how others do so in formalized research that marketers and others in business use.
I especially like how Brian has clearly explained each of the characteristics of Behaviorgraphics ("personality types" for want of another way of saying it). The graphic uses descriptors that are increasingly being used in the mainstream: words like "curators" and "conversationalists" and he offers concise but compelling descriptions of each one.
I expect we’ll see Behaviorgraphics in use a lot in the coming months, and not only because Brian is offering various sizes and resolutions on free download including one perfect for inserting into a PowerPoint deck.
What will be most interesting to see is how Behaviorgraphics is described by different people. I expect to see many different descriptions, variations of Brian’s core concepts. And that doesn’t matter at all if it helps you better understand how people engage online and with whom. And I see this complementing other metrics and analyses such as the technographics ladder.
Incidentally, Brian Solis is the keynote speaker at the Dell Social Media B2B Huddle in London on March 17 that I’m helping to organize (and in which you can participate virtually via the hashtag #dellb2b). No doubt we’ll hear a lot about Behaviorgraphics.


